From the original article on November 15, 2021. Author: eugyppius.
Something is wrong with the vaccines:
From the latest RKI “situation report,” we get this useful graph, of the seven-day incidence of infection broken down by five-year age brackets:
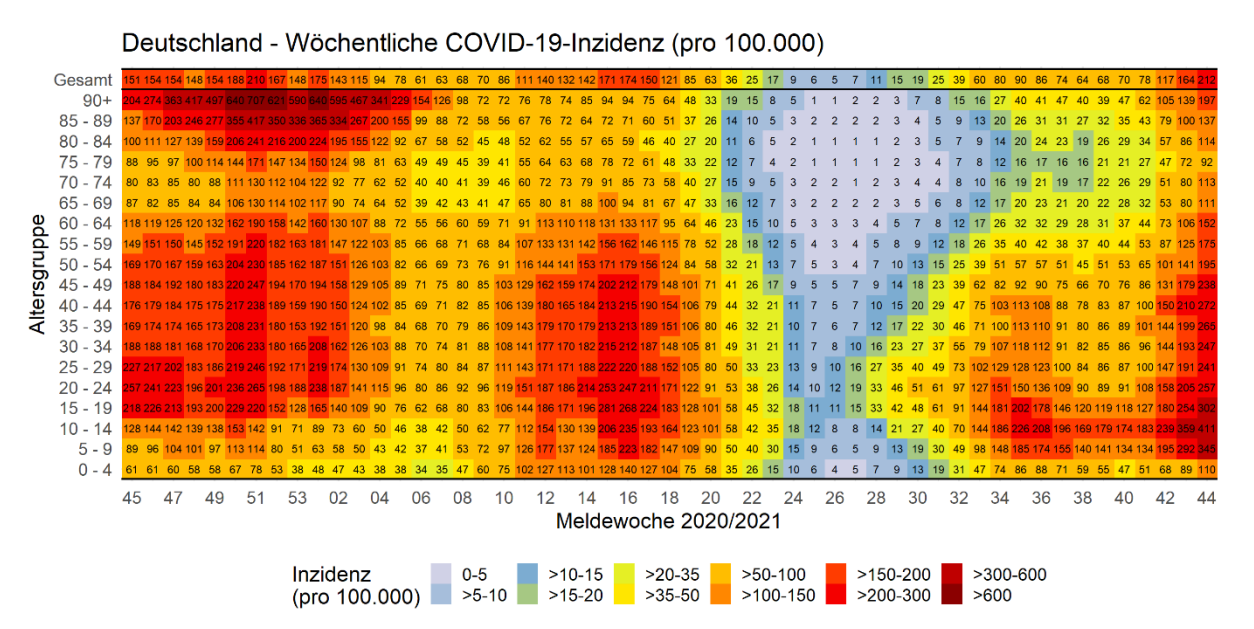
The y-axis gives the “age groups,” the x-axis is the “week of report,” so there is in total a whole year of data here, from 2 November 2020 to 7 November 2021.
Ignore the very high incidences for school-age children at the bottom. They’re tested multiple times a week for Corona and almost no case escapes notice. Comparing the extreme right and left edges of the graph for older cohorts, we can see that 90+ is the only age category, where there is any improvement compared to this time last year. Everyone else is seeing higher rates of infection. Antigen testing may be a small part of the explanation here, but it can’t account for the whole effect, particularly not in the working-age population.
Now hospitalisations by age category:
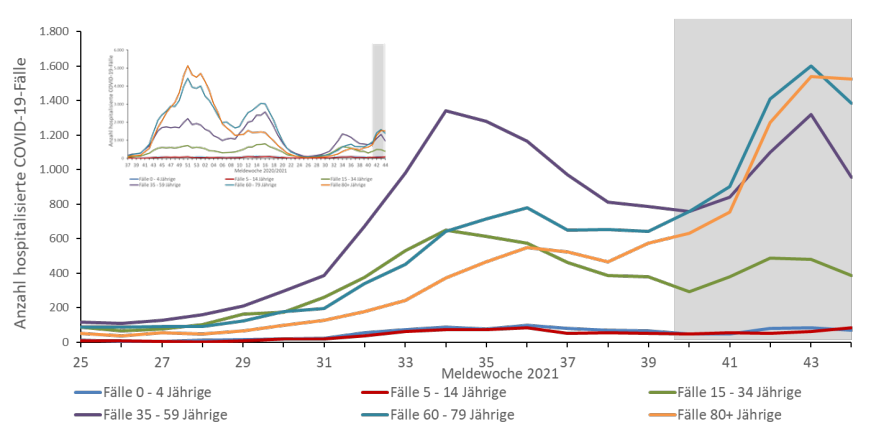
The inset graph is last year, for comparison. For August and September (weeks 30-39), you can see how the lesser-vaccinated 35–59 year-olds (purple) dominated hospitalisations. Now, as we enter late fall, the 80+ crowd (orange) are taking the lead, with the 60–79s just behind them. Precisely the same thing happened last year. All those things we heard over the summer, about how higher infections and hospitalisations in lower age brackets reflected their lower rates of vaccination, were not really true. The clear pattern, also observed last year, is that summer infections are primarily in younger age groups, while the deadly winter infections affect primarily the olds.
Here is Corona ICU occupancy:
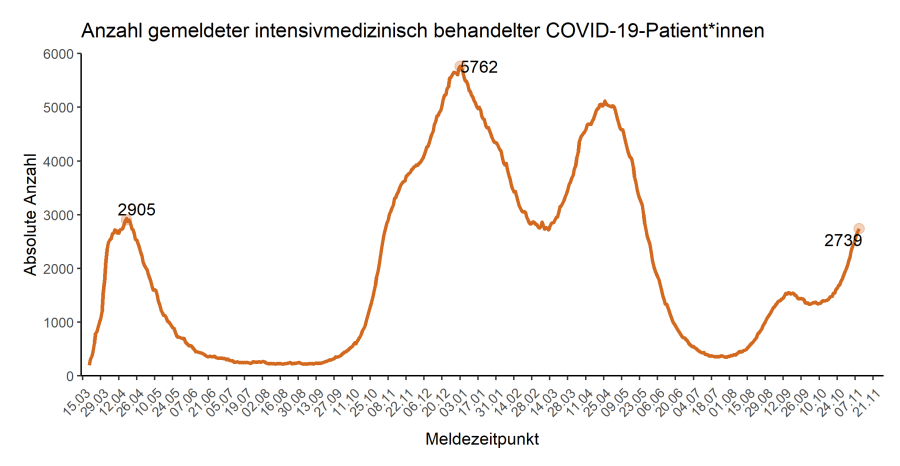
We are very slightly below where we were on 15 November 2020, with many more cases. Once again, the strong impression is that the vaccines extend some protection, while also massively increasing transmission, such that the overall statistics remain more or less unchanged.
Unfortunately, ICU statistics aren’t clearly broken down by age category [this is wrong: see UPDATE], but deaths are:
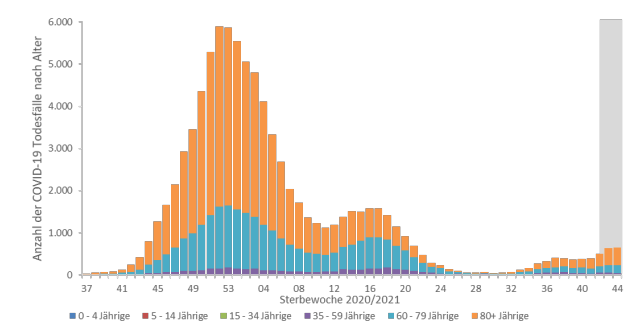
Orange is again 80+, blue is 60–79. This is not a pandemic of the unvaccinated. It is a pandemic of older people, and the vaccines are obviously powerless to change this trend.
As for vaccine surveillance, the German statistics are of much lower quality than those provided by the UK Health Security Agency. For the 60+ age category (85.6% vaccinated), we read (p. 22) that 60.9% of symptomatic cases from 11 October to 1 November were in the fully vaccinated, as were 45.1% of hospitalisations, 36% of ICU admissions, and 41.7% of deaths.
So-called 3G rules in Germany required the unvaccinated, in most places and for most of the four weeks studied here, to submit to antigen testing in order to eat at restaurants and participate in public events. Any negative efficacy, like that seen in the UK numbers, will be hidden by this lopsided testing regime. This is one of the reasons that the UK numbers are so important. As rising cases trigger stricter 2G rules, which exclude the unvaccinated regardless of testing, there’s a good chance this begins to change. It’s therefore interesting to see plans by our new coalition government to impose test requirements on the unvaccinated for the use of public transit.
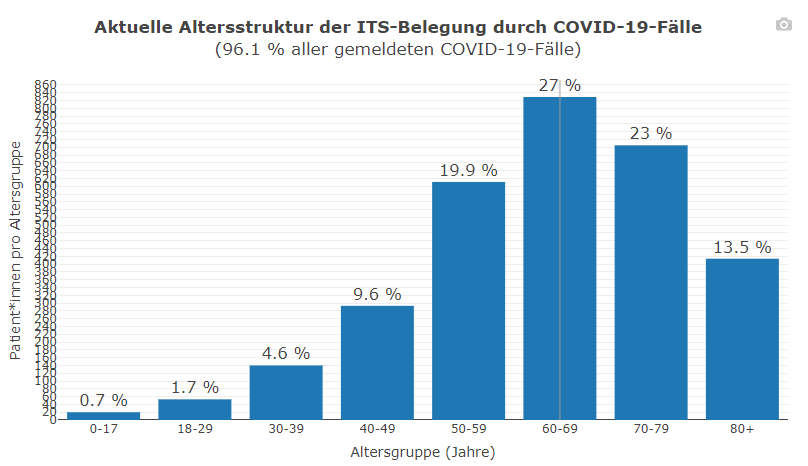
UPDATE: Commenter cm27874 reminds me that Germany does break down ICU occupancy by age now.
Library of Chadnet | wiki.chadnet.org