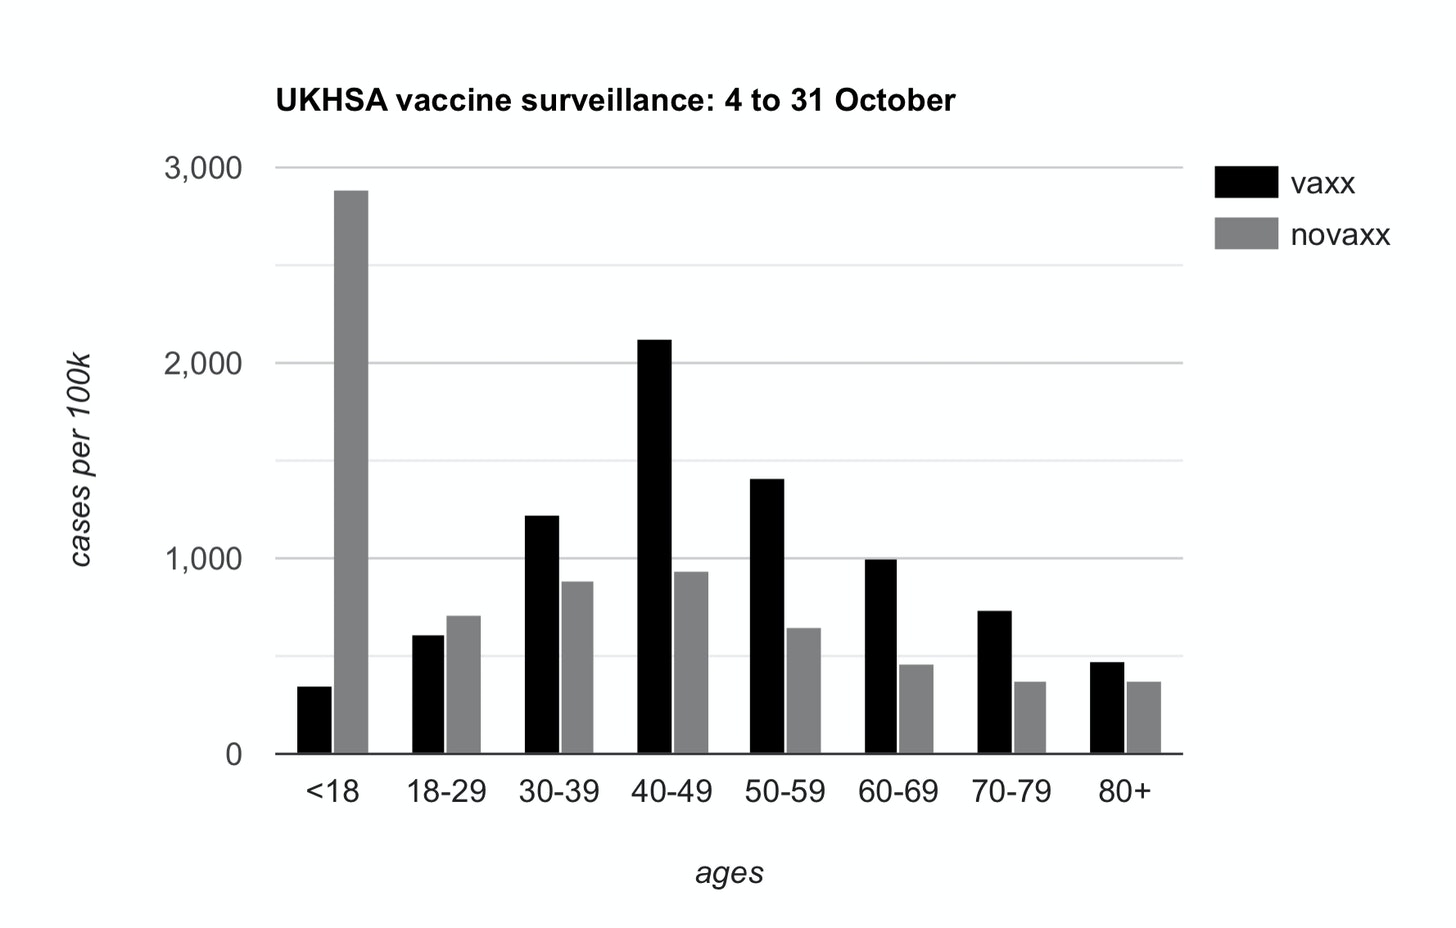
From the original article on November 5, 2021. Author: eugyppius.

Yet again I had to draw this graph myself, and yet again, the UK Health Security Agency wants you to know that these rates are extremely, totally, absolutely unadjusted. They just don’t know precisely why or how.
As I noted on Twitter, it’s emerged that UKHSA inserted all of their ill-advised disclaimers after coming under fire from the Office of Statistics Regulation, a regulatory body which periodically complains about statistics published by the British government.
OSR director Ed Humpherson met with UKHSA hours before they published their Week 43 report, demanding they do something about these awkward graphs. They responded by ditching the graphs altogether and calling every last number unadjusted. This failed to satisfy him, so in the days afterwards he issued this unbelievable open letter.
Dear Jenny,
COVID-19 vaccine surveillance statistics
Thank you for the constructive meeting on Thursday 28 October to discuss the UK Health Security Agency’s (UKHSA) COVID-19 vaccine surveillance statistics. We focused on the risk that the data presented on rates of positive cases for those who are vaccinated and those who are unvaccinated have the potential to mislead – and indeed we noted that these data have been used to argue that vaccines are ineffective.
We welcome the changes you have made to the Week 43 surveillance report, published on 28 October. It is also very good that you are working closely with my team and with the relevant teams in the Office for National Statistics (ONS).
The UK has backed itself into publishing some less-than-useful numbers. Now the office responsible for this publishing will have to work closely with a gaggle of political commissars, responsible for cleansing official discourse of anything that might be “used to argue that vaccines are ineffective.”
Because he appears to be a genuinely stupid man, Humpherson spells this point out explicitly:
It remains the case that the surveillance report includes rates per 100,000 which can be used to argue that vaccines are not effective. I know that this is not the intention of the surveillance report, but the potential for misuse remains. In publishing these data, you need to address more comprehensively the risk that it misleads people into thinking that it says something about vaccine effectiveness.
Emphasis mine. The next time somebody tells you that UKHSA reports show substantial protection against severe outcomes, draw their attention to Ed Humpherson’s letter. He thinks these numbers don’t tell you anything about anything. This is the first step towards not publishing them at all.
This is not just about the choice of denominator. It is about recognising that the comparison of case rates for vaccinated and unvaccinated groups is comparing datasets with known differences – including, potentially, the greater propensity of people who are vaccinated to come forward for tests. So the data reflect a behavioural phenomenon, not just a feature of how well vaccines work. I do not think your surveillance report goes far enough in explaining this crucial point.
Emphasis mine again. Humpherson has no idea what behavioural factors might be at issue. He is just throwing random ideas at the wall, here. And notice how he slithers from what is “potentially” true to totally unqualified and unsupported assertions about is true (“the data reflect a behavioural phenomenon”). Maybe the higher unvaccinated death rates also “reflect a behavioural phenomenon“ and are “not just a feature of how well vaccines work.” As long as we are allowed to speculate baselessly, let’s do it in both directions.
He goes on to voice the old and tired complaint about the NIMS data. He wants UKHSA to use ONS population estimates instead. While the former might well understate the case rate among the unvaccinated, the latter is sure to overstate it, but Humpherson doesn’t care.
One possibility would be to only publish rates in the vaccinated population, which are known accurately, but I recognise your concern that you are already publishing rates for both groups.
Confirmation yet again of the obvious: They are only publishing these numbers because they locked themselves into doing so early on, when they looked good.
The alternative would be to use the ONS population estimates, which are used in the main coronavirus dashboard but which may be flawed for some age groups, as you have pointed out. … In the meantime, you should consider setting out these uncertainties more clearly, including by publishing the rates per 100,000 using both denominators, and making clear in the table, perhaps through formatting, that the column showing case rates in unvaccinated people is of particular concern.
That column is of particular concern because Humpherson doesn’t like the numbers in that column. He doesn’t care about the other columns because those numbers are neutral or pleasing to him.
And he closes with this:
I recognise that you want to maintain transparency and consistency, but these qualities should not be at the expense of informing the public appropriately.
Remember, always, that all Corona statistics are propaganda.
The UKHSA have issued a separate set of disclaimers on their website. Every line is fairly hilarious. And the Office of Statistical Regulation provides their own wall of text, where they show that if you understate the unvaccinated population with ONS numbers, indeed you can get the unvaccinated case rate to go up. Humpherson and his crack team of statistics regulators just love the ONS numbers, but UKHSA don’t like them so much. This is because UKHSA actually have to compile minimally plausible tables and for this they are unworkable. From p. 15 of the Week 44 report:
When using ONS, vaccine coverage exceeds 100% of the population in some age groups, which would in turn lead to a negative denominator when calculating the size of the unvaccinated population.
Library of Chadnet | wiki.chadnet.org